Javascript Articles
5 New Features of ECMAScript That You Shouldn't Miss Learning
Understanding and Preventing Memory Leaks in JavaScript Applications
Top Technologies to Learn for a JavaScript Backend Developer
Ruby on Rails vs JavaScript: A Comprehensive Analysis for Backend Development [2024]

Get In Touch For Details! Request More Information

Best Tips and Tricks for JavaScript Debugging Skills [2024]
Mar 22, 2024 3 Min Read 396 Views
(Last Updated)
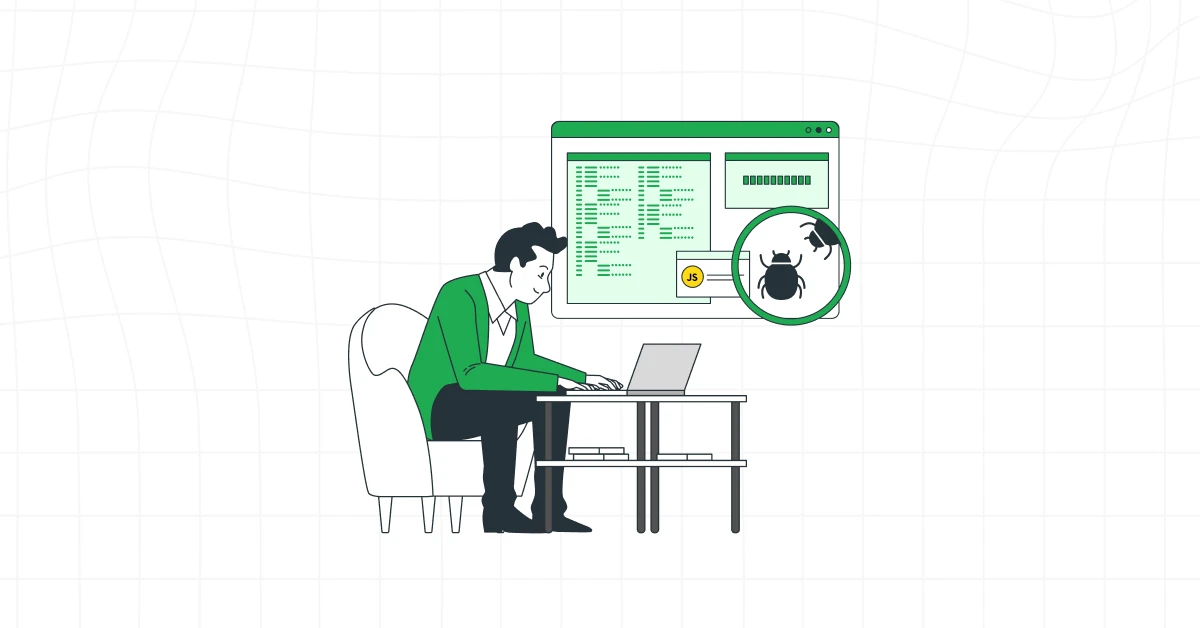
Where there’s a huge demand for JavaScript, having the skills is not just enough, you must also have a sound knowledge of JavaScript Debugging skills. These debugging skills will help you to debug your code and find if there’s any error in the code and then rectify it.
To build a completely error-free website, you have JavaScript debugging skills. If you’re afraid that you do not know what skills you must have, or the tips or tricks you must follow while debugging JavaScript code, you’re at the right place.
In this blog, we will walk on a journey to unlock the secrets of mastering JavaScript debugging with a compilation of tips and tricks that will elevate your development process.
Table of contents
- What is JavaScript Debugging?
- Tips and Tricks for JavaScript Debugging
- Explore the Power of Browser Developer Tools
- Strategic Use of Console Methods
- Using Breakpoints Efficiently
- Master the Art of Stepping Through Code
- Watch Expressions for Deeper Insights
- Proficiency in Network Tab
- Source Maps
- Mastery in Asynchronous Code
- Prioritize Exception Handling
- Explore Browser-Specific Features
- Conclusion
- FAQs
- What is the best way to debug JavaScript?
- How to improve debugging skills in JavaScript?
- Are there any browser extensions to enhance JavaScript debugging?
- What are 3 debugging strategies?
What is JavaScript Debugging?
JavaScript debugging is the process of identifying, analyzing, and resolving errors or bugs in your code. As a developer, your debugging skills are akin to a detective’s keen eye, allowing you to uncover and eliminate issues that might hinder the optimal performance of your web applications. JavaScript is used by 98.7% of websites as a client-side programming language.
Also, Find Out the Best JavaScript Roadmap Beginners Should Follow in 2024
Tips and Tricks for JavaScript Debugging
Let’s discuss some of the great tips and tricks for JavaScript debugging you should follow to build an error-free website:
1. Explore the Power of Browser Developer Tools
You must have a good knowledge of the developer tools like Chrome, Firefox, and Edge. Browser Developer Tools are great platforms that help developers perform functionalities like inspecting, debugging, and optimizing web pages and web applications. Some of the key features are:
- HTML/CSS Inspection
- Network Monitoring
- Breakpoints and log points
- JavaScript Debugging
- Security Analysis
Explore More: Best JavaScript Frameworks in 2024
2. Strategic Use of Console Methods
The second best tip is the usage of console methods which are JavaScript powerful tools used for debugging and logging information in JavaScript applications. These methods offer multiple functionalities that understand the behavior of the code and check for errors.
Using these methods can help improve your debugging workflow, which resolves issues efficiently during development. You can use console.log() to print information and console.error() to log errors.
3. Using Breakpoints Efficiently
Breakpoints in JavaScript debugging are a kind of pause button that puts a pause at a specific line of code. This is used for debugging complex code/troubleshooting issues. This can be done using various methods:
- Using debugger statement
- Using console.log()
- Conditional Breakpoints in Browser Developer Tools
- XHR and Event Listener Breakpoints
Also Read: Best JavaScript Practices Every Developer Must Follow

4. Master the Art of Stepping Through Code
The fourth best tip is mastering the art of stepping through code which is crucial for effective debugging and understanding the flow of execution in your programs. You can use a few commands
- Step Into (F11): This command allows you to step into the next function call.
- Step Over (F10): This command allows you to step over the next function call.
- Step Out (Shift + F11): When you’re inside a function, this command allows you to step out of the current function and return to its caller.
- Continue (F8): Use this command to resume execution until the next breakpoint is encountered.
- Inspect Variables: While stepping through code, inspect the values of variables and expressions to understand how they change over time.
Also Read: Master Backend Development With JavaScript | Become a Pro
5. Watch Expressions for Deeper Insights
Using a watch expression is another great tip for a JavaScript debugging technique that allows you to monitor the value of variables or expressions as your code executes/during debugging.
You can use features like tracking state changes, monitoring variables, evaluating expressions, conditional watches, function calls, etc. This watch expression provides you with real-time updates on critical data points without cluttering the console.
Explore Top 10 JavaScript IDEs and Code Editors You Should Know
6. Proficiency in Network Tab
Another great tip is using the network tab which is an essential tool for troubleshooting issues related to network requests, such as AJAX calls, fetching resources, or handling responses from APIs. If you use this tool, you’ll easily be able to resolve errors and debug issues related to network requests in your JavaScript applications.
Also, join GUVI’s Full Stack Development Course and transform your development approach.

7. Source Maps
Another great tip is the usage of source maps, which are files that map the code of a transpiled JavaScript to the source code. They use breakpoints, stepping through code to debug applications more efficiently.
It improves the quality of error reports by providing stack traces and error messages that reference the source files, making it easier to identify and fix bugs in production code.
Must Read: 6 Best Front-End JavaScript Frameworks To Learn In 2024
8. Mastery in Asynchronous Code
Asynchronous Code Mastery is again a great idea by which you can debug JavaScript code. You can use tools for handling promises, async/await, and callbacks. This can be done using various methods:
- Understanding Asynchronous Patterns
- Use Debugging Tools
- Error Handling
- Understanding Event Loop
- Promises and Promise Chains
- Async/Await
Use CodeKata to take your coding skills to the next level. This can help you become a better programmer and crack coding interviews
9. Prioritize Exception Handling
One great idea for JavaScript debugging is the usage of exception handling. It involves identifying, diagnosing, and resolving errors that occur during the execution of a JavaScript program.
Using Catch Exceptions with try…catch: Place critical sections of your code inside a try…catch block to catch and handle exceptions. When an exception occurs within the try block, control is passed to the catch block where you can log the error or take appropriate action.
try {
// Code that might throw an exception
} catch (error) {
// Handle the error
console.error(error);
}
10. Explore Browser-Specific Features
You should also try browser-specific features to effectively debug JavaScript code, and optimize performance. Let’s look at some of the prominent features of browsers:
- Google Chrome
- DevTools
- Async Stacks
- Source Maps
- Event Listener Breakpoints
- Mozilla Firefox
- Firefox Developer Tools
- Debugger Statement
- Network Throttling
- Memory Profiling
- Microsoft Edge:
- Edge Developer Tools
- Async Call Stacks
- Performance Profiling
- Safari
- Web Inspector
- Timeline Recording
- Resource Timing
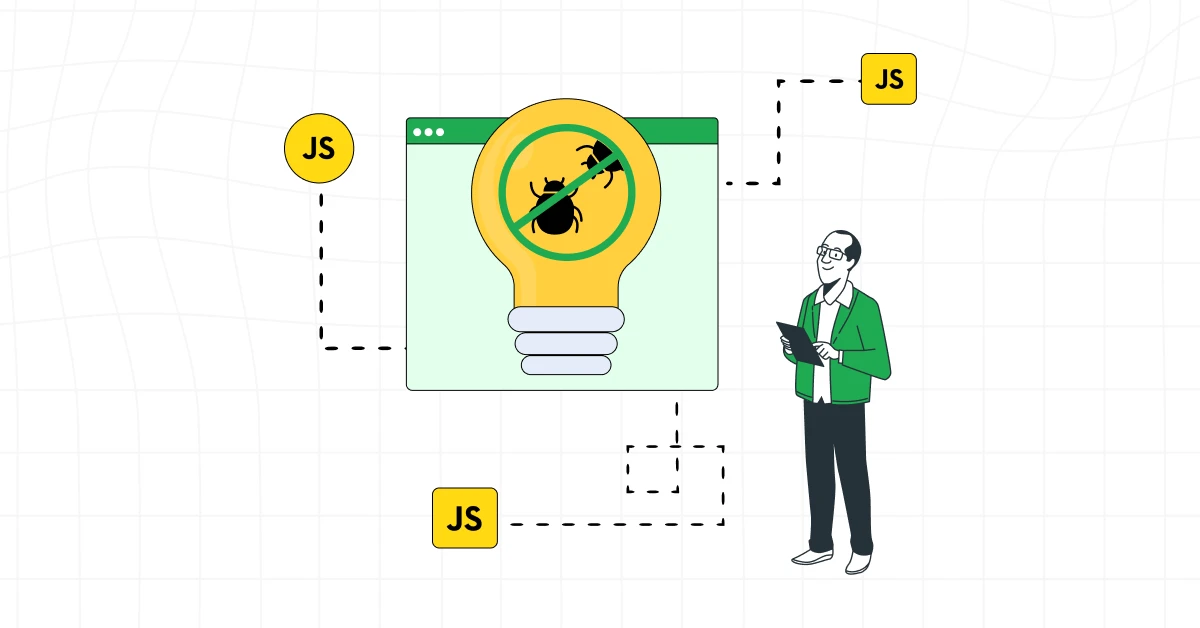
Conclusion
Now that you know some of the great tips and tricks you should follow to improve your JavaScript debugging skills, follow them efficiently. you must follow these practices while building a JavaScript-rich website. These techniques will help you to craft robust, error-free code that stands the test of digital time.
Must Find Out 30 Best JavaScript Project Ideas For You [3 Bonus Portfolio Projects]
FAQs
What is the best way to debug JavaScript?
The best way of JavaScript Debugging is logging into the console. You can just add a statement “console.log(“GUVI”);” which will create a GUVI entry in the JavaScript console of your respective dev tools set.
How to improve debugging skills in JavaScript?
There are many techniques with which you can improve your JavaScript Debugging skills. Some of them are:
a) Mark breakpoints
b) Step through the code line-by-line
c) Use of console methods and browser developer tools
Are there any browser extensions to enhance JavaScript debugging?
Yes, browser extensions like React DevTools for React applications and Vue.js DevTools for Vue.js applications can enhance your debugging capabilities in specific frameworks.
What are 3 debugging strategies?
The 3 debugging strategies are:
1) examine the error
2) identify the cause
3) rectify the error
Career transition


Did you enjoy this article?